 beekap
 weestab
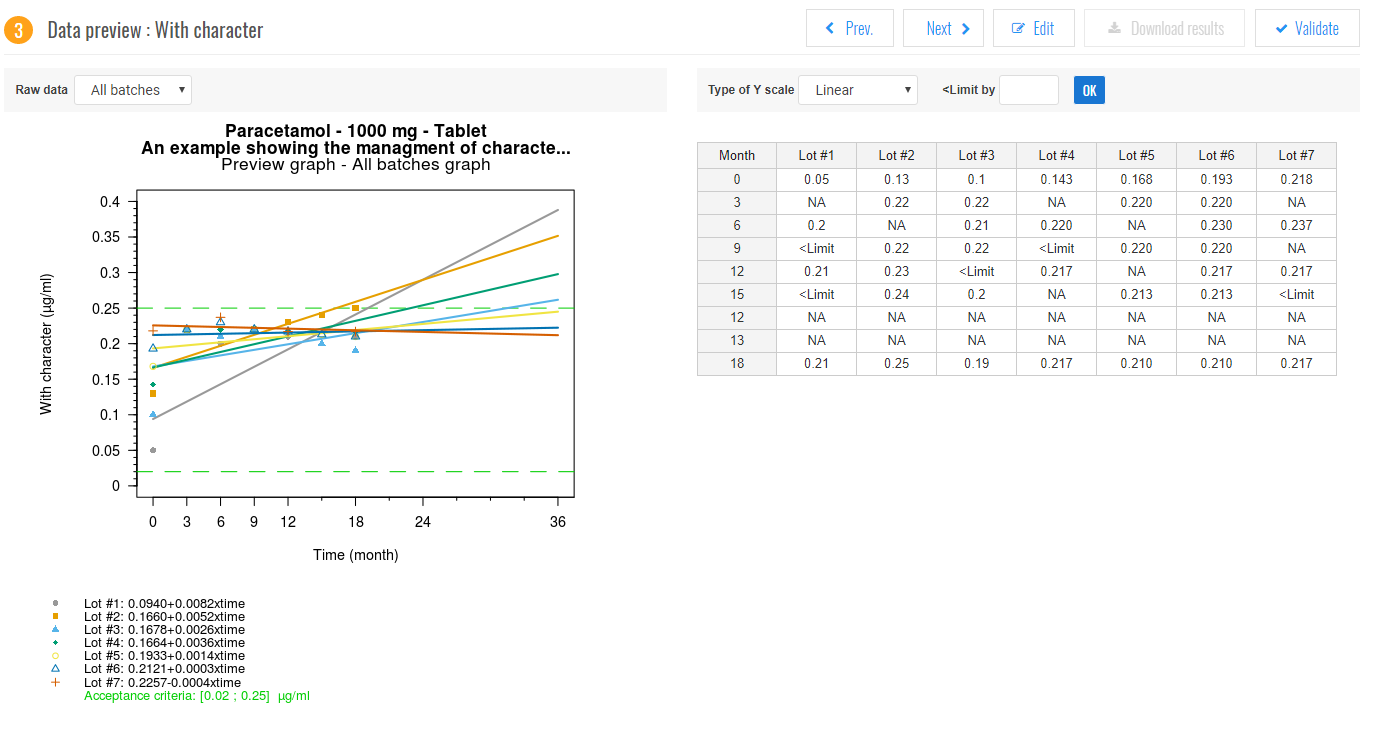
Preview
This step performs a simple linear regression for each batch to verify the model validity and the data consistency (capture error,…).
- Click on Validate to launch calculation for the parameter.
Note: It is possible to modify data and parameter information at this step. Parameter data can be modified directly on the grid. Parameter information can be modified via the Edit button.
The kinetic is not linear
If the linear kinetic assumption is not fulfilled, it is possible to transform data by applying a log10 transformation.
- Select Logarithm (resp. Linear) to apply log10 transformation (resp. to cancel log10 transformation)
Note: The transformation is applied only if all data of the studied parameter are strictly greater than zero.
Tip: The transformation is visible on the Y axis of the preview graph.
What about “<LOQ” values
Values noted “<LOQ” can be replaced by a numeric value. The replacement value is then used in the statistical analysis.
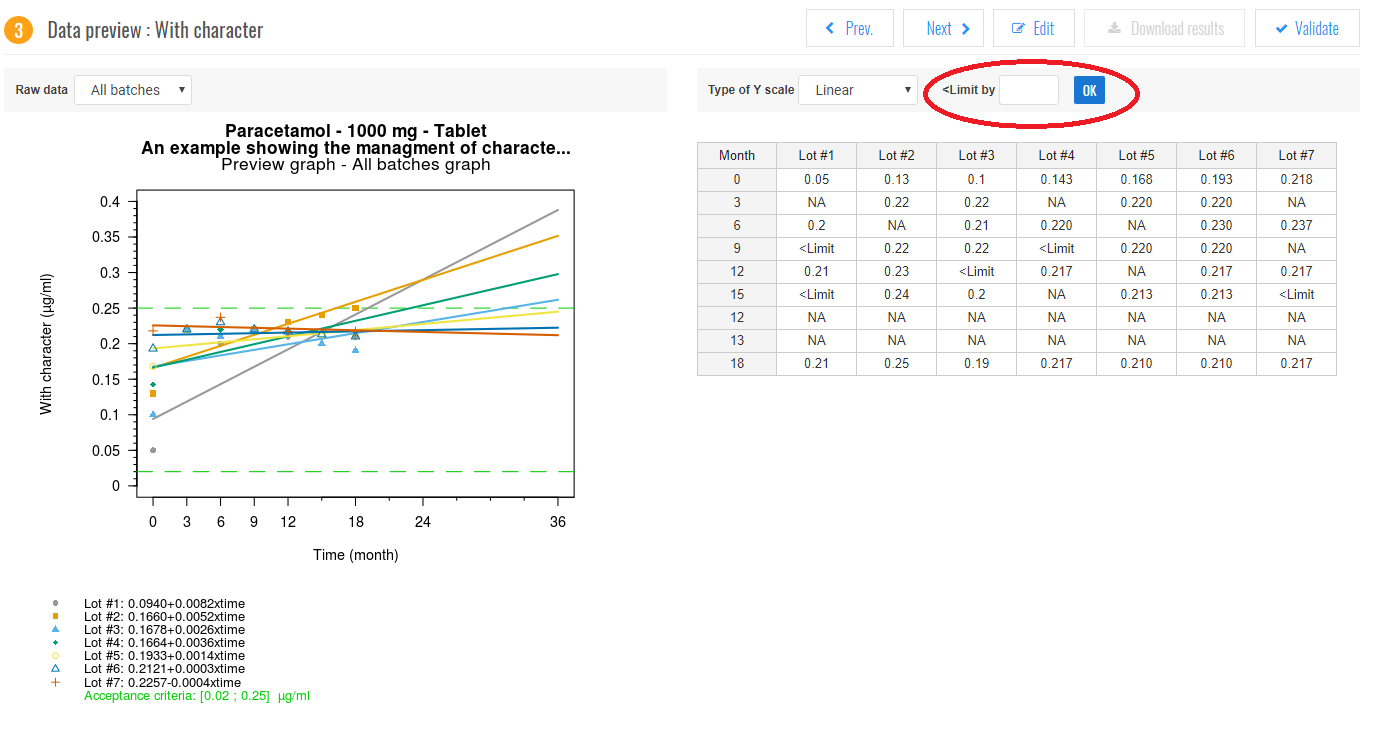
Note: If a negative or 0 value is entered on a log transformed parameter, the parameter is automatically switched to the linear default.
Tip: Values noted “<LOQ” can be replaced by LOQ/2 or LOQ/sqrt(2). The replacement is visible on the data grid.
Shelf-life computation
The ICH recommendations are applied for the shelf-life calculation.
In presence of more than one batch, the poolability of data is tested with a significance of 25%.
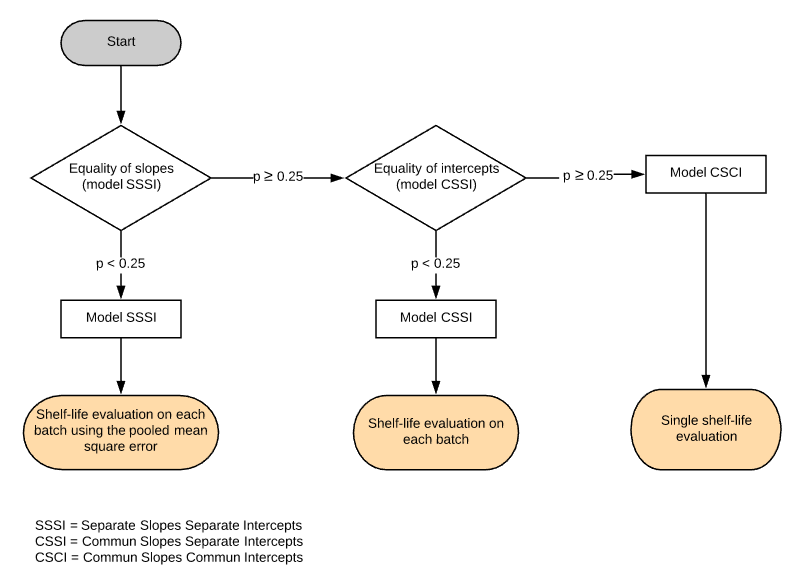
According the final scenario from the above algorithm, the final shelf-life is calculated according to the ICH recommendations. For reminder, a 95% lower (resp. upper) confidence bound is used for a parameter known to decrease (resp. increase) in time. For a parameter that can either increase or decrease with time, a 95% two-sided confidence interval is used.
Note: If the data from all batches cannot be combined (SSSI or CSCI), the final shelf-life is the minimum of shelf-lives.
Note: Shelf-lives are floor rounded and are report as:
- “>15” with year unit when the estimated shelf-lives are greater than 15 years
- “>150” with month unit when the estimated shelf-lives are greater than 150 months
- “>100” with week unit when the estimated shelf-lives are greater than 100 weeks
- “>350” with day unit when the estimated shelf-lives are greater than 350 days
- “>48” with day unit when the estimated shelf-lives are greater than 48 hours
Quality of the fit
Residuals are plotted against time point. You typically want residuals randomly scattered around zero.
Release limit
Release limits are computed automatically. They ensure that the claimed shelf-life is achieved.
Tip: The estimated shelf-life is calculated whereas the claimed shelf-life is the desired one.