 beekap
 weestab
Individual control chart
Graph property
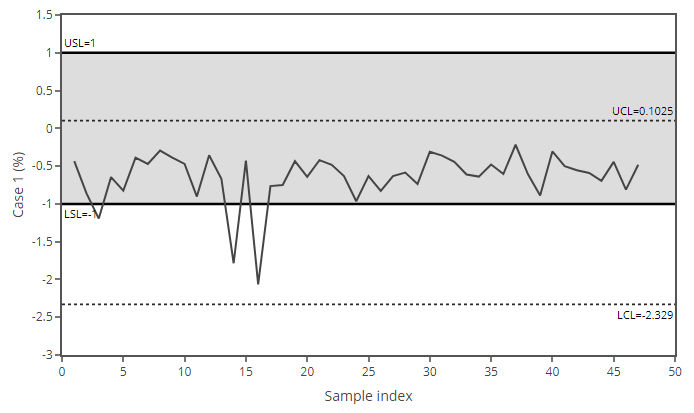
Control chart is a graph used to study how the process changes over time. Data are plotted in time order.
In the scope of Product Quality Review, specifications are added to identify quickly out of specifications results. The acceptable zone, that is the area where results are compliant with specifications, is displayed in grey.
Note: In presence of several replicates per batch (scenario 4), replicates observations are displayed jointly with the replicates average for each batch.
Note: Select YES on user Preferences to show Control Limits.
Note: If data follow a normal distribution, Control Limits are defined as CL = Mean +/- 3 * SD
Where
- CL = Control limit
- Mean = average
- SD = standard deviation as presented in Descriptive statistics
If data do not follow a normal distribution, control limits are calculated from percentiles (X0.135% and X99.865%) of the smooth curve or data according to the user Preference Cnpk formula.
Graph events
- Click on the + button and drag to zoom in. Click on the – button to rescale the graph.
- Click on the rectangle and drag to exclude observations. Give the reason for the exclusion. Graphs and analysis are then updated automatically without excluded observations.
- Hover data to compare data or investigate a single data point.
Histogram/box-plot
Graph property
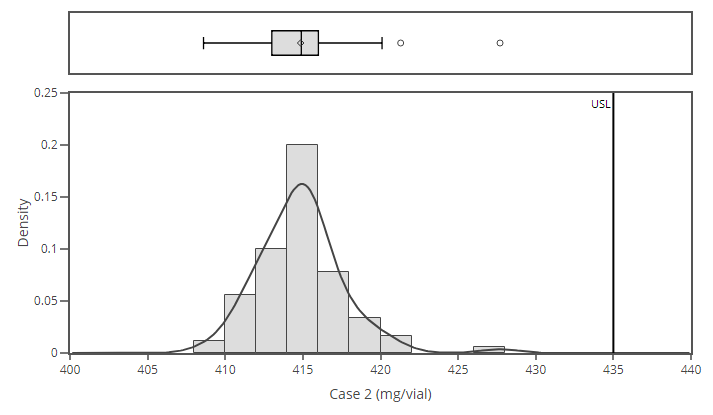
The capability histogram shows the distribution of your sample data. Each bar represents the frequency of data within an interval.
Curve displayed on the histogram is the normal distribution curve if the data follow a normal distribution. If the Normality Test fails to conclude to a normal distribution, the distribution is adjusted with a smooth curve.
The box-plot displays the distribution of data based on summary statistics. It is helpful to detect atypical values. It informs on the data skewness, on the full range of variation and the likely range of variation.
Note: In presence of several replicates per batch (scenario 4), histogram/box-plot are performed on the replicates average.
Graph events
- Hover box-plot to identify atypical values.